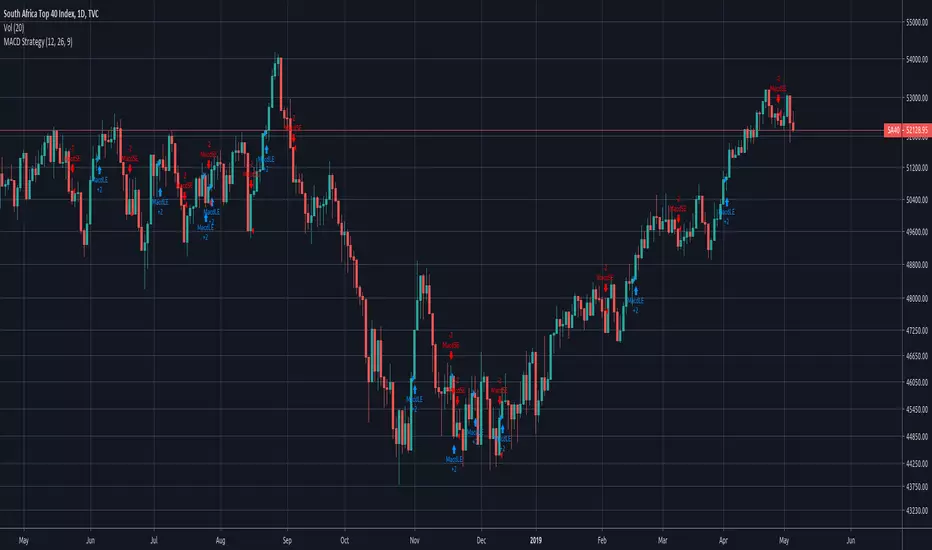
EVWMA VWAP MACD Strategy [QuantNomad]Based on comment of @coondawg71 I tried to compare VWAP and EVWMA.
Both are sort of moving averages so I decided to create a MACD based on these 2 indicators.
In parameters you can set EVWMA Length and 2 smoothing lengths for "macd" and "signal".
Strategy seems to work pretty good at 2h-8h timeframes for crypto.
What do you thing about it?
Cari dalam skrip untuk "macd strategy"

Simple MACD Strategy - CrossoverSimple MACD Crossover Strategy
No secret sauce here!
Script was requested by user
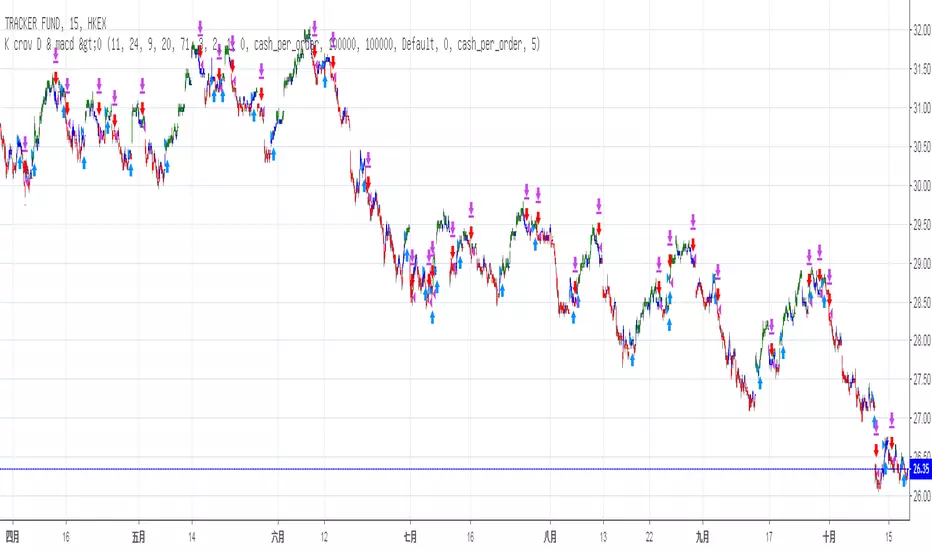
Stochastic & MACD Strategy Ver 1.0This strategy is inspired by ChartArt and jasonluk28.
The following input changes from the initial ChartArt version to achieve higher stability and profit:
Fast MA Len:11
Slow MA len: 24
Stoch Len: 20
No difference is found in minor changes (+-10) lv. of overbought/oversold
It works above 40% winning rate in Heng Heng Index, Shanghai Composite, Dow Jones Industrial Averge, S&P 500 NASDAQ, VT (World Total Market) and in 15 mins chart
Profit: above ~10 to 30% in less than 1year backtest for most major indice of China and US and ~62% in Heng Seng Index (Hong Kong) & 40.5% in SZSE Composite (Shen Zhen)
P.S. Profit: 700 (Tencent) +150.5%, 939 (CCB) +66.5%, 1299 (AIA) +45%, 2628 (CLIC) +41%, 1 (CK Hutchison) +31%
NFLX +82.5%, BABA +55.5%, AMZN +44%, GOOG +38%, MCD +24.5%
However, Loss in FB -19% , AMD -38.5%
Not suitable for stocks with great influences in News or Events ???
Ergotic MACD Strategy Backtest This is one of the techniques described by William Blau in his book
"Momentum, Direction and Divergence" (1995). If you like to learn more,
we advise you to read this book. His book focuses on three key aspects
of trading: momentum, direction and divergence. Blau, who was an electrical
engineer before becoming a trader, thoroughly examines the relationship
between price and momentum in step-by-step examples. From this grounding,
he then looks at the deficiencies in other oscillators and introduces some
innovative techniques, including a fresh twist on Stochastics. On directional
issues, he analyzes the intricacies of ADX and offers a unique approach to help
define trending and non-trending periods.
Blau`s indicator is like usual MACD, but it plots opposite of meaningof
stndard MACD indicator.
You can change long to short in the Input Settings
Please, use it only for learning or paper trading. Do not for real trading.

MACDouble & StochRSI w/ safeties and variable time interval v0.3UPDATE:
IMPORTANT!!! MAKE SURE "RECALCULATE AFTER ORDER FILLED" IS CHECKED. I will have it on by default in the future.
This is a continuation of my previous scripts of two MACD indicators with a Stochastic RSI indicator.
New features:
- Alternate MACD time interval
You can now set the time interval for the second MACD indicator to a different resolution than the displayed chart.
Uncheck the box and select the desired interval. For example, if your chart is set to 15min then first MACD will be set at 15 min and you can select 5 min for the second MACD.
- Alternate StoRSI time interval
You can (and should) set the StochRSI to a different time interval as well. StochRSI hasn't worked great with previous versions. Now you can set it to a different time resolution as well. I strongly recommend you set it at a higher (slower) resolution; for example if your chart is set at 15min then you should test setting the StochRSI at 30 or 45min.
- ' True" StochRSI logic
Trading logic for StochRSI is now a true StochRSI, instead of just reading "k" and ignoring "d", K now has to be greater than D to buy and less than to sell.
- Safeties
A primitive but low risk safety in the form of an uptrend/downtrend price safety. If current close+high isn't greater than the previous close and high then the buy order will not be executed. The same applies for sell orders.
- Cap on losses from short positions
A stop loss safety set to 9000 for exiting sell positions. This will need refinement in the future but this puts a cap on losses from any sell position. At an initial currency of 10,000 this translates to 90.00. If it is giving you problems simply delete line 78 from the source code.
Please feel free to ask any questions or send me suggestions. This is still very much a work in progress and I'll try to polish up the rough spots but it is fully functional. With a slower StochRSI and the safeties I have gotten it to consistently outperform the old 2x MACD strategy script---typically by 3-fold.

CCI-MACD Strategy 4.2
I cerchi si basano sull'oscillatore CCI (Commodity Channel Index).
L’indicatore CCI ci permette di osservare se il livello attuale del prezzo è particolarmente al di sopra o al di sotto di una certa media mobile, avente un numero di periodi scelto da noi.
Più la deviazione dal prezzo medio nel breve termine è forte, e maggiormente l’indicatore si allontanerà dallo 0: verso l’alto in caso di uptrend, o verso il basso in caso di downtrend.
Il segnale viene dato quando il valore del CCI supera la linea dello zero.
Il tutto è filtrato con un altro indicatore, il MACD, acronimo di "Moving Average Convergence Divergence", usato per identificare cambiamenti nel momentum del prezzo.
The circles are based on the CCI (Commodity Channel Index) oscillator.
The CCI indicator allows us to observe whether the current price level is significantly above or below a certain moving average, with a number of periods chosen by us.
The greater the deviation from the short-term average price, the further the indicator will deviate from 0: upwards in the case of an uptrend, or downwards in the case of a downtrend.
The signal is given when the CCI value crosses the zero line.
This is all filtered through another indicator, the MACD, which stands for "Moving Average Convergence Divergence," used to identify changes in price momentum.

Waddah Attar Explosion with TDI First of all, a big shoutout to @shayankm, @LazyBear, @Bromley, @Goldminds and @LuxAlgo, the ones that made this script possible.
This is a version of Waddah Attar Explosion with Traders Dynamic Index.
WAE provides volume and volatility information. Also, WAE calculation was changed to a full-on MACD, to provide the momentum: the idea is to "assess" which MACD bars have significant momentum (i.e. crossover the Explosion Line)
TDI provides momentum, divergences as well as overbought and oversold areas. There is also a RSI on a different timeframe, for convergence.
Almost everything is editable:
- All moving averages are customizable, including the TRAMA, from @LuxAlgo
Waddah Attar Explosion_
- Three different crossing signals: histogram crossing contracting Explosion Line, expanding Explosion Line and ascending Explosion Line while both Bolling Bands are expanding; Explosion Line shows different color when expanding.
- Explosion line signals: Below DeadZone line and Exhaustion (highest value in a given lookback period). You can set a predefined EPL slope to filter out some noise.
- Deadzone signal : Deadzone squeeze ( lowst value in a given lookback period)
TDI:
- Overbought an Oversold signals. The OB and OS shapes have two colors, in order to display extreme signals on current timeframe or extreme signals on current and different time frame.
- Visual display of RSI outside the Bollinger Bands, and crossing of RSI Moving Average crossing of zero line.
I believe this combination is great for so many reasons!
Like the idea of TTM Squeeze? You can tune the Deadzone and Explosion lines to look for a volatility breakout
Like trading divergences or want to filter out extreme areas? The RSI is great for that
You like the using the MACD strategy but don't like the amount of false signals given? this WAE version filters some of them out.
If you are a Bollinger bands fan, you can customize both indicators to trade breakouts and/or mean reversion strategies, and filter out exhaustion of the bands expansion
This is my first publication, so give it a go and provide feedback if possible.

MACD BF 🚀Customised MACD strategy with dynamic stop losses based on ATR.
Signals are generated when the delta value becomes positive or negative (when it crosses the zero line)
Stop losses are printed on the chart in yellow and orange. They are based on recent average True Range to allow for volatility.
INSTRUCTIONS
Green background = long
Red background = short
Yellow dotted line = stop loss placement for long
Orange dotted line = stop loss placement for short
White background = you have been stopped out, wait patiently for the next signal


Trendless MACD Strategy (Trendless Strategy Series -1 )I Try to eliminate the trend of the stock to see a clear version of the indicators. If you have any idea about that topic, you can send a message to me and we can improve this idea together.

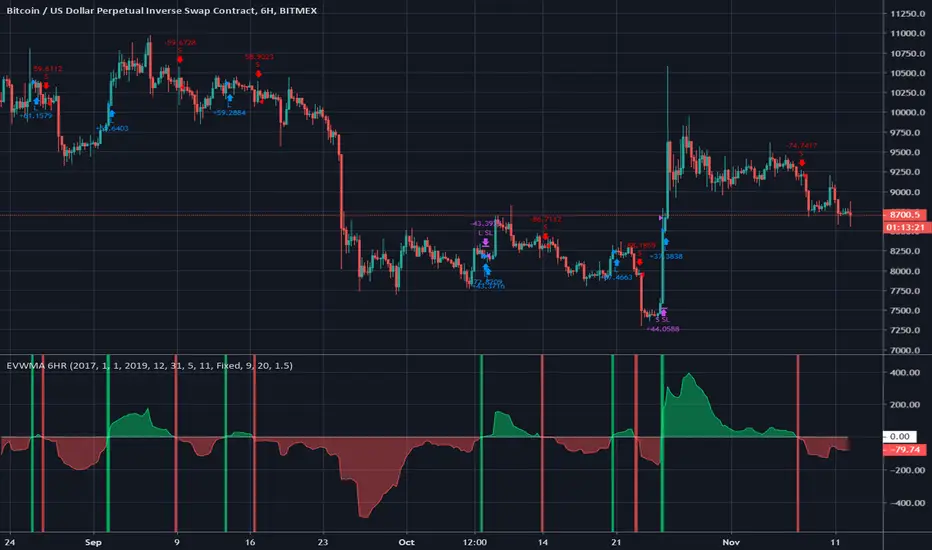
EVWMA 6HR BFCredit goes to QuantNomad for the idea behind this code. Here
is the original script.
This strategy simply goes long on a cross above zero of the calculated delta line and short on a cross down below zero.
The delta line is calculated using 2 volume based moving averages.
There is a fixed 9% stop loss but you can change this to an ATR Derived stop in the settings.
MACD_Long_OnlyI created this indicator to calculate the gains that can be made purely by going long on the market. For exchanges without the ability to short, the standard MACD strategy is unable to accurately calculate the profit/loss from entering and exiting a position, as it includes profit/loss from actively shorting the market, which may either not be possible, or be undesirable for a specific asset.

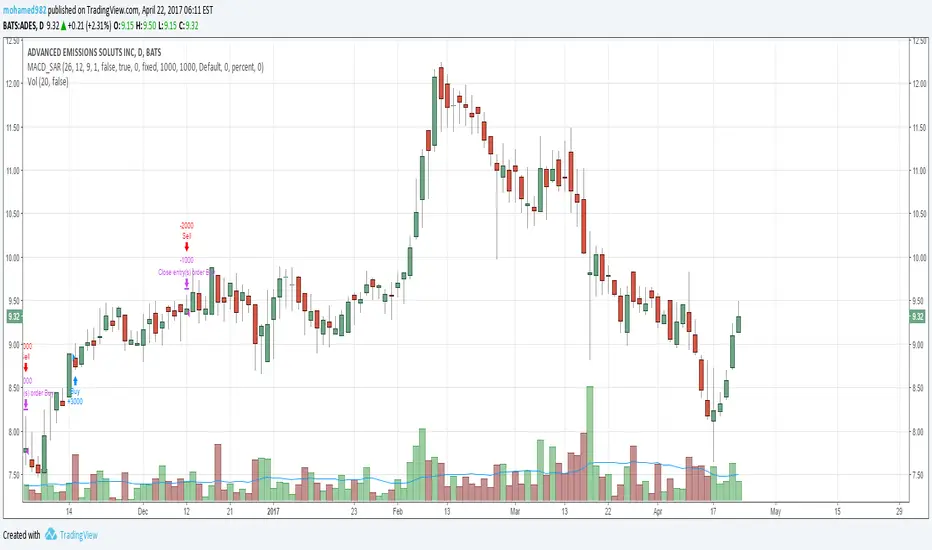
MACD_SARParSar and MACD strategy depends on the crosses of PARSAR indicator above/below the closing price and is filtered by the MACD indicator. it yields good profits on stocks. however, it doesn't work very well for Forex if you want to use it on forex please apply it to higher time frame starting from 4H.
CVD Divergence + Volume HMA RSI MACD StrategyHow the script works:
The script calculates the HMA for trend direction. The HMA (shown in orange) is used as a filter: long trades are taken only if price is above the HMA, and short trades when below.
The CVD is computed by cumulatively adding volume on up bars and subtracting volume on down bars.
Pivot routines (with the input "Pivot Length") detect swing lows/highs for both price and CVD. A bullish divergence is flagged when the price makes a lower low while the CVD makes a higher low. Similarly, a bearish divergence is flagged when the price makes a higher high while the CVD makes a lower high.
Trading is triggered when the divergence condition also agrees with the HMA filter.
Feel free to further adjust the parameters or add risk‐management/exit rules as needed for your trading style.

MA Tester Need Help please ;)Hello,
I'm new in scripts.
I build this one based on the MACD Strategy one but it look like mine don't plot buy and sell arrows on my chart, why?
thanks for help
